It is the commitment of Santa Rosa Junior College to promote the full participation and academic success of all individuals, including those from all historically underrepresented student groups. Student Equity will be determined to have been achieved when the composition of students who enroll, are retained, transfer, or achieve their educational goals, mirror the diversity in the District’s population.
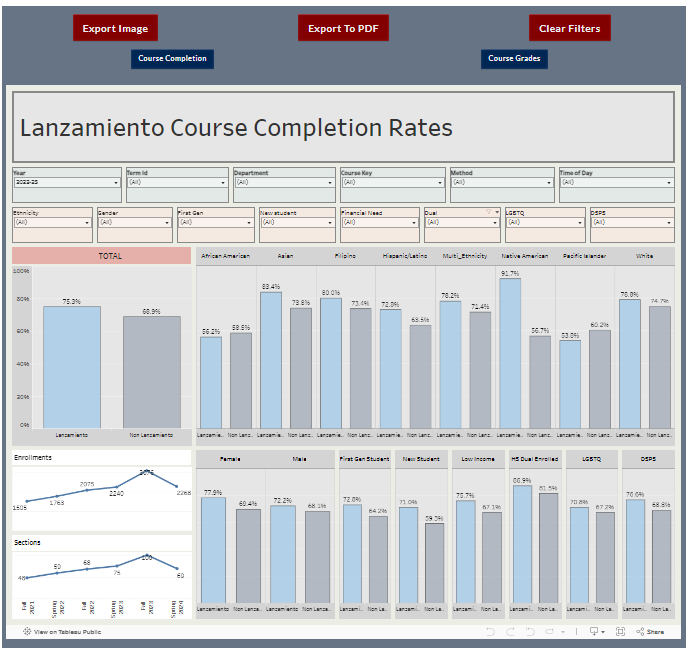
Lanzamiento Dashboard
Academic course completion and grade distributions by student demographics.
Indicators for Institutional Effectiveness Dashboard
This dashboard displays institutional outcomes that include the Chancellors' Vision for Success metrics, Math and English 1st year & AB1705, Successful Enrollment form the application phase, and course completion rates. Aggregate and disaggregate options.
Comprehensive Expanded Student Ethnicity
Student ethnicity/race is expanded in this dashboard that unpacks the Multi-Ethnic group, presenting every ethnicity selection students' made in the CCCApply application. Counts and proportions (%) will have duplications.
2022-23 AB1705 Disaggregated Outcomes
The most recent years' (2022-23) disaggregated outcomes for successful completion of transfer-level Math or English within one-year.
SRJC: At a Glance
Student and Employee Demographics. Including student status (Ed Goal, FT/PT, Special Populations, & Headcount by Trustee Area.
Dual Enrolled Student Demographics
Dashboard includes headcounts and proportions by High School for the last 4-YEArs (2019-20 to 2022-23).
Student Annual Outcomes
Dashboard shows students course outcomes disaggregated primarily by FT/PT status, as well as ethnicity, gender, and special populations.
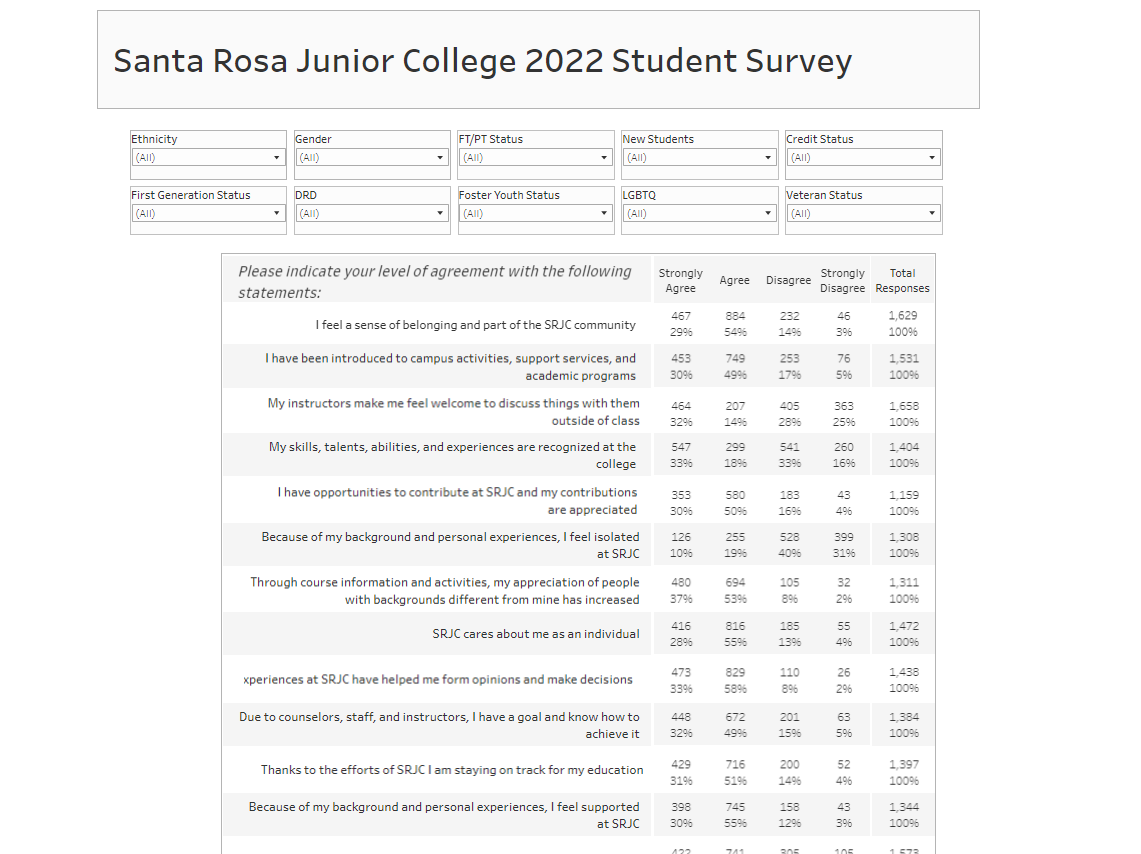
2022 Student Survey
The Fall 2022 Student Survey Visualization to the right can show total and disaggregated student responses to "Respect", "Climate", "SLO", and "Enrollment Preference" questions.
Student Equity Plan 2.0 Data and Resources
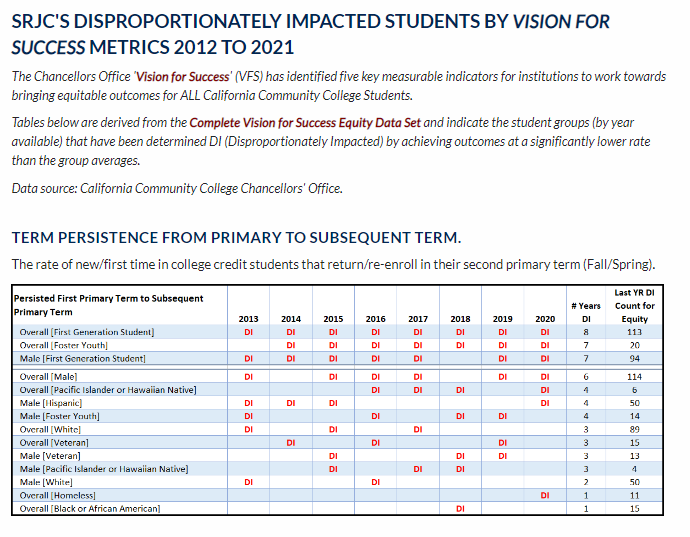
Click the thumbnail to the right to view our 2022 Student Equity Plan, Vision for Success Disproportionately Impacted Students, and Interactive Data Visualization.
SRJC Transfers
Dashboard shows disaggregated transfer headcounts from 2016 to 2020.
BLANK
Placeholder.