The Factbook contains current and historical data about Sonoma County Junior College District. We currently have information on student enrollment, degrees and completions, courses, admission and financial aid, tuition and required fees, and employees. The figures found here may differ from those found elsewhere due to population definitions and timing of data collection.
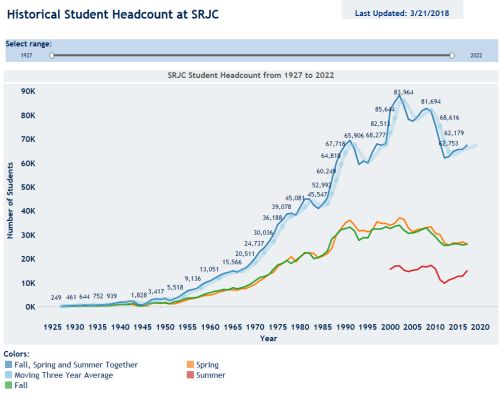
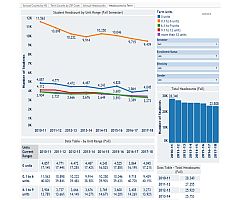
Historical Enrollments by Semester
Click on the thumbnail to learn about the growth of our College from its beginnings in 1918 to the present day.
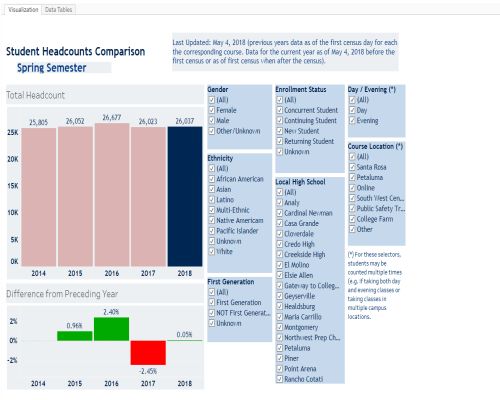
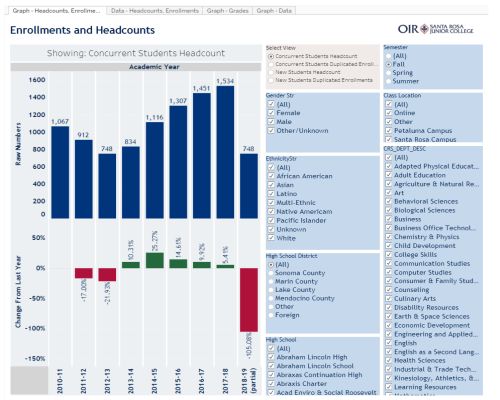
Student Headcount Comparison - Current Semester
This visualization compares the non-duplicated student headcount for the current semester against the same semester for the last four years. The numbers are dis-aggregated by student demographics as well as the High School they graduated from and the campus locations of the courses they are enrolled in SRJC.
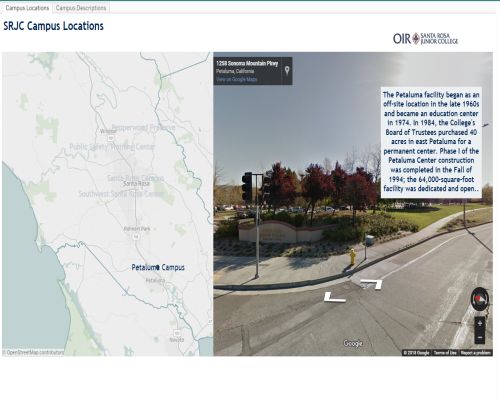
Sonoma County Junior College District - Campus Locations
See the main campus locations of the SCJCD together with the Google Maps view and a brief description of each campus. The street address and the main phone number of each campus may also be found here.
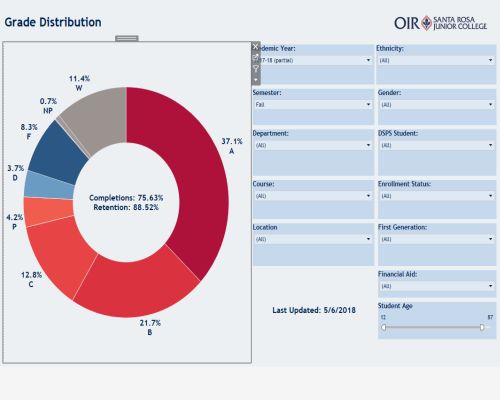
Grade Distribution in Credit Courses
What are the grades dis-aggregated by a large variety of factors like student demographics, campus location, course, etc? Find out here. Dis-aggregated completion rates and retention rates are also shown. Data for the last nine academic years is available here.
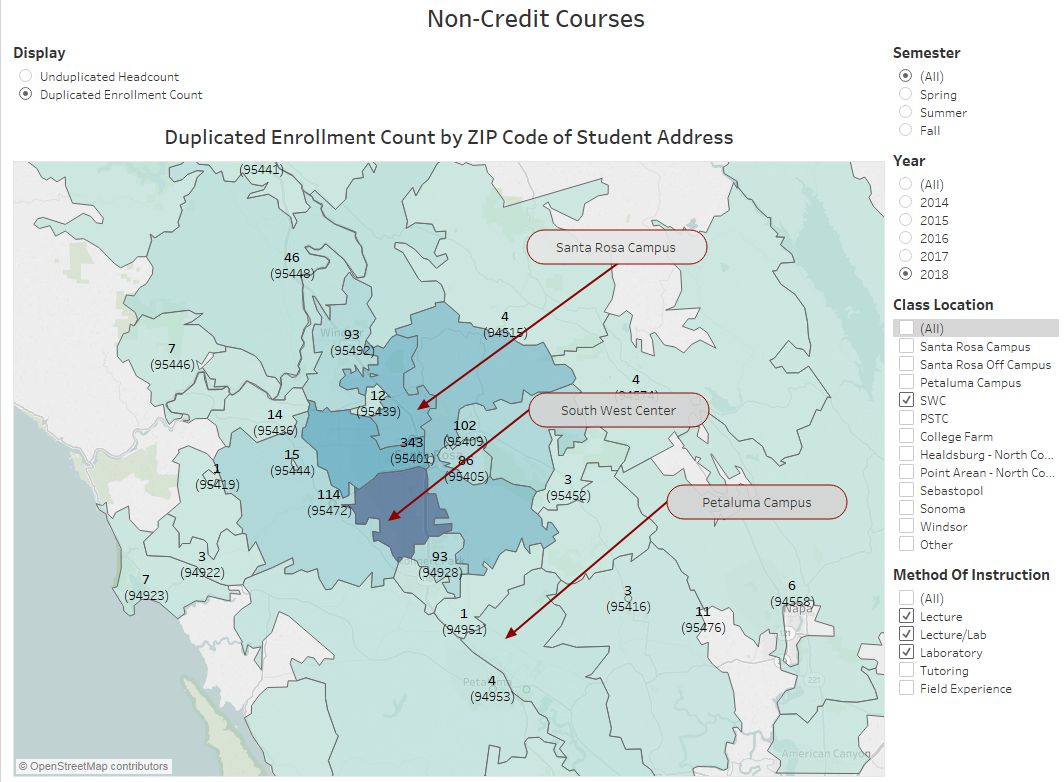
Non-credit Course Enrollments and Headcounts
Data for the last four academic years is available here.
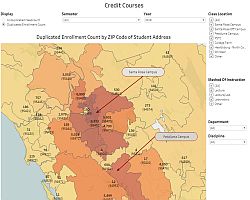
Credit Course Enrollments and Headcounts
Data for the last four academic years is available here.
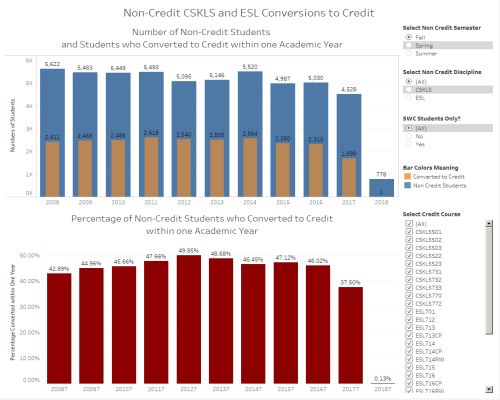
Non-credit to Credit Conversion Rates
Find out here how many students taking non-credit courses in one semester start taking credit courses in the consecutive semesters. Data for the non-credit ESL and CSKLS courses for the last ten years is shown here.
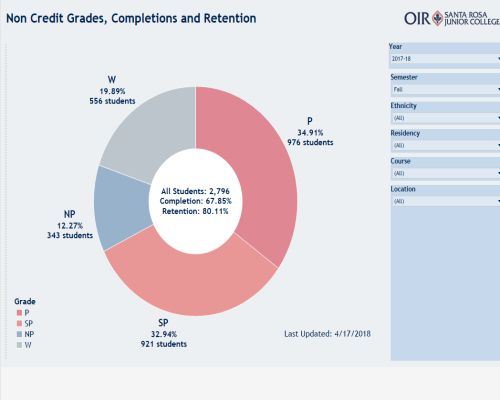
Grades, Completions, Retention for Non Credit Courses
Find out what are the grades for non-credit courses at SRJC (yes, non-credit courses may be graded too). Dis-aggregated completion rates and retention rates are also shown. Data for the last nine academic years is available here.
High School Enrollments - Concurrent and New
Find out what are the grades for non-credit courses at SRJC (yes, non-credit courses may be graded too). Dis-aggregated completion rates and retention rates are also shown. Data for the last nine academic years is available here.
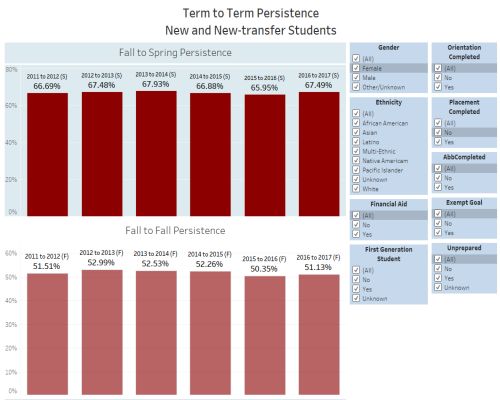
Term to Term Persistence
Persistence (i.e. enrollments in consecutive terms) for new and continuing students, dis-aggregated by the usual demographics factors as well as various matriculation aspects. The data spans the last seven years.
Term to Term Persistence - by Campus Location
Persistence (i.e. enrollments in consecutive terms) for new and continuing students, dis-aggregated by the usual demographics factors as well as various matriculation aspects. The data spans the last seven years.
Enrollments
Various data visualizations that show the annual and semester student headcounts comparisons for the last 6 years.
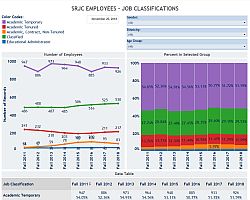
Sonoma County Junior College District Employees
Various visualizations that summarize the positions and demographics of the District employees.
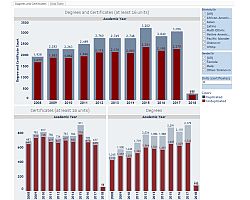
Degrees and Certificates
The degrees and Certificates granted by SRJC.
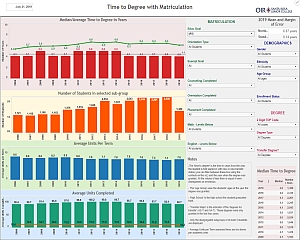
Time to Degree (with Matriculation Information)
Average and Median times to get a degree at SRJC (for various population groups and various degree types)
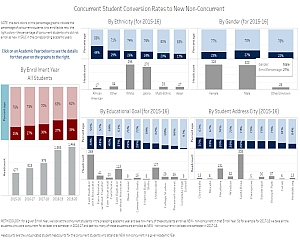
Concurrent to New Enrollment Conversions
Percentages of High School concurrent students who enroll as new after they graduate High School.
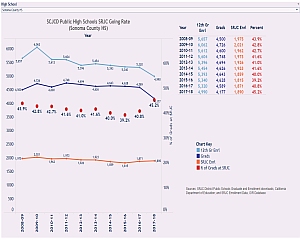
HS College Going Rate
Percentages of public High School graduates in Sonoma County who enroll at SRJC in the Fall semester after HS graduation.
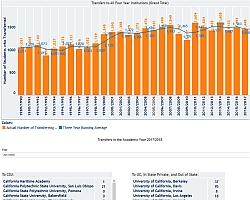
Transfers to Four Year Institutions
Numbers of students who transfer to four year universities each year. Includes California State University system, University of California system, In State Private and Out of State institutions.